
A Central Hub for Quality and Productivity
Understanding quality and productivity in localization and linguistic quality assurance (LQA) projects often means checking several platforms and reconciling disconnected data. When information is not clearly linked to a project, teams have to extract and compare it manually, adding time and increasing the risk of error. Assessing linguistic quality also requires context: the content, the workflow, and the linguists’ experience all matter.
Gaia’s Reports section brings project quality and productivity data into the same environment where the work happens. Information captured within Gaia gives operational leaders a shared starting point for assessing progress, investigating issues, and deciding where support is needed.
This tutorial introduces the Reports landing page. Future tutorials will explore the individual reports in more detail.
QA Overview
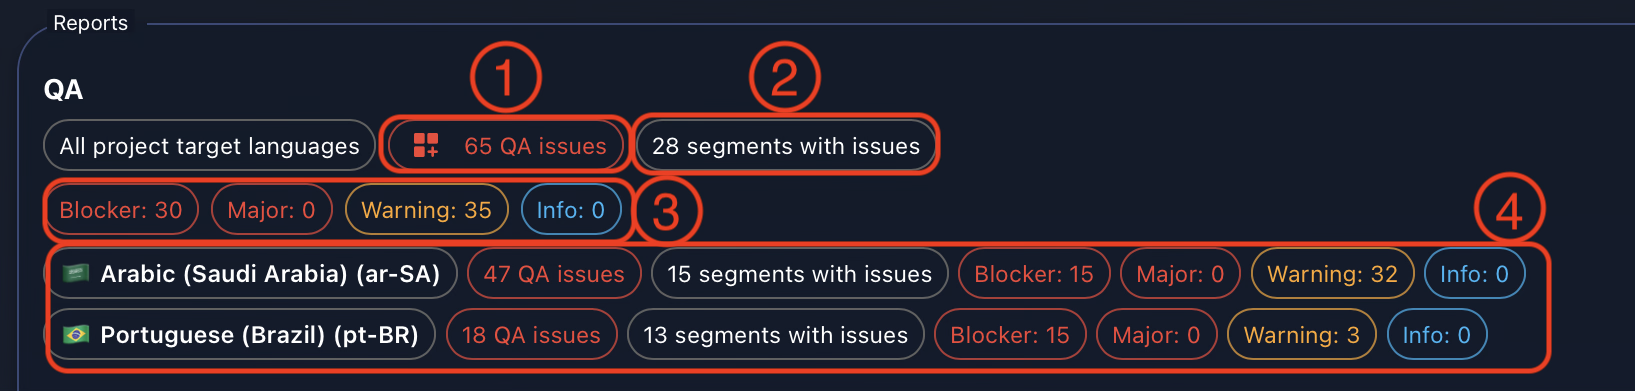
Just below the project card, the QA overview provides a current snapshot of issues across the project’s target languages. It shows the total number of QA issues (1), the number of segments with issues (2), and a breakdown by severity: Blocker, Major, Warning, and Info (3).
The language breakdown (4) connects those totals to each target language, showing issue counts, affected segments, and severity levels side by side. This helps project owners identify where to investigate first. A segment can have more than one issue, so the issue total and the affected-segment count answer different questions.
Productivity Overview
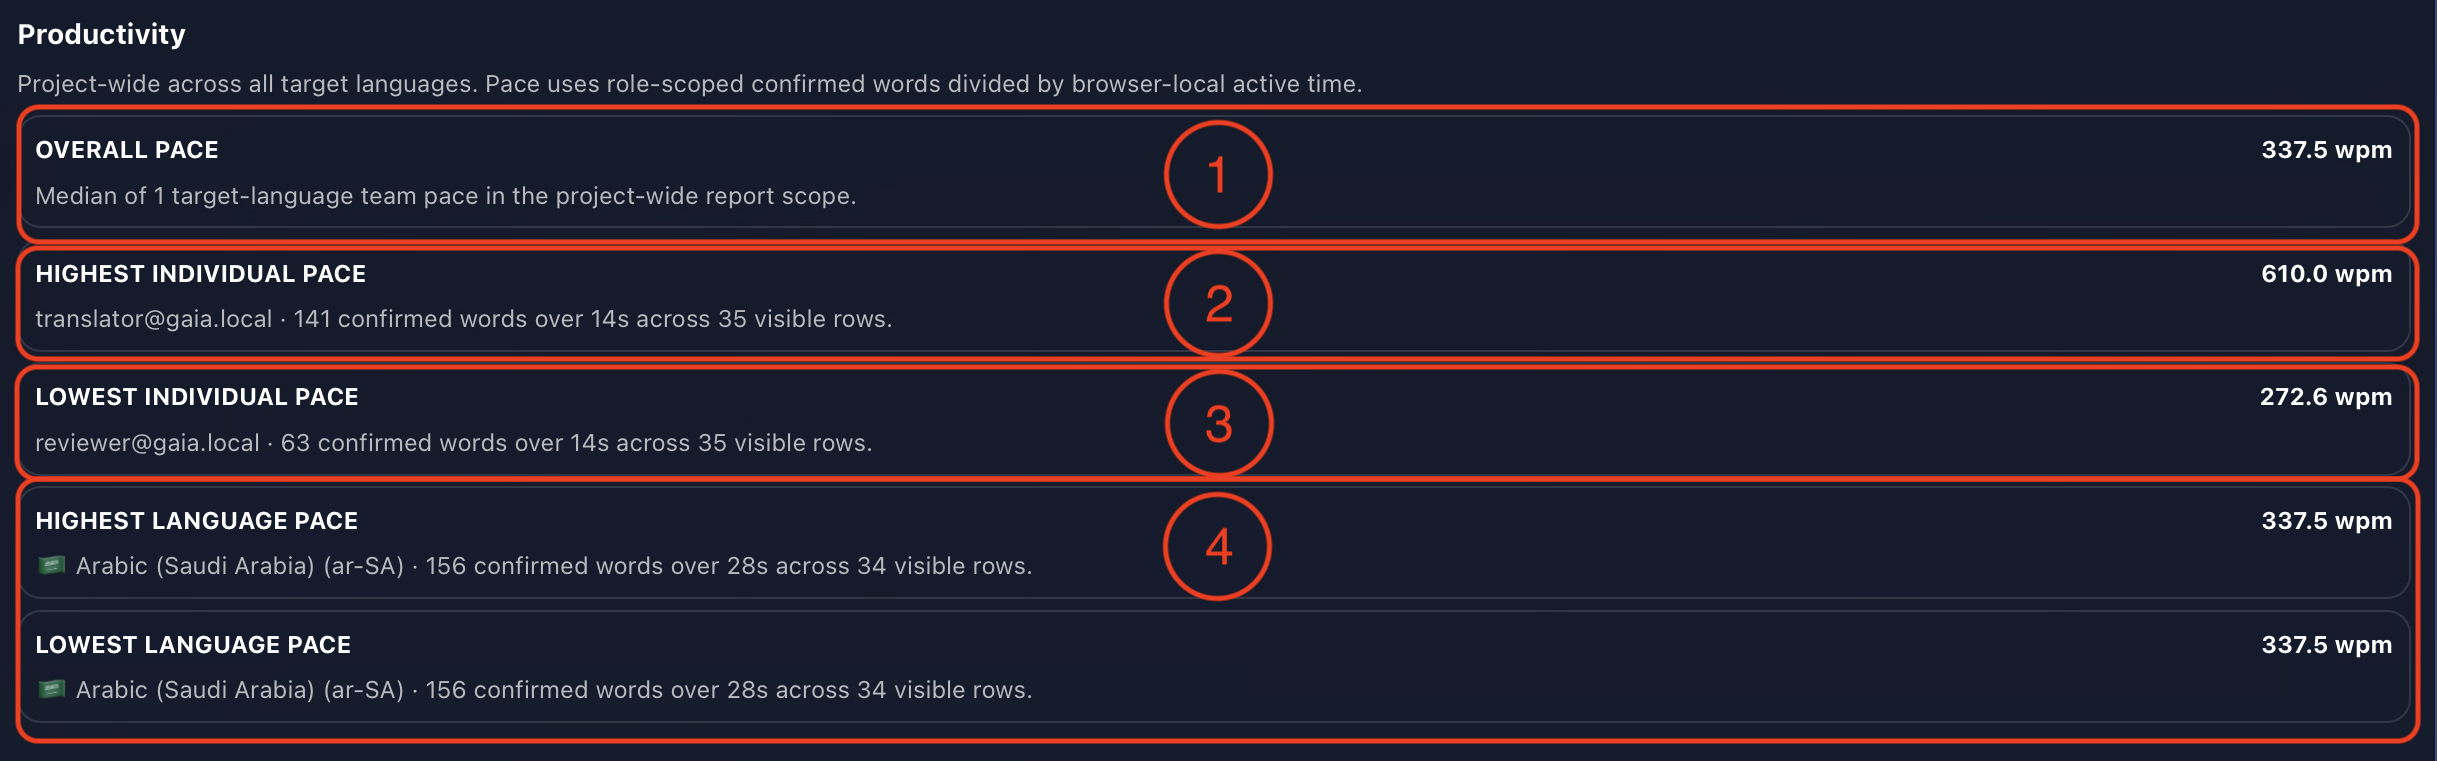
Gaia expresses productivity as words per minute (wpm), using confirmed words for the relevant role divided by browser-local active time. Depending on the project’s workflow, those words relate to translation, review, or approval. The landing page brings these pace metrics into view as work progresses.
Overall pace (1) summarizes team productivity across the project’s target languages. In the view shown here, it is the median of the target-language team paces within the report scope. Highest individual pace (2) and lowest individual pace (3) identify the contributors at either end of the measured range. The language metrics (4) highlight the highest and lowest language paces.
Read these figures alongside the confirmed word counts and recorded active time. Pace is a useful signal for investigation, but it does not explain every difference in output or establish linguistic quality. A linguist may be waiting for context, working through difficult content, or dealing with source issues that need correction before localization can continue. Short measurement periods can also produce unusually high or low rates.
Quote Estimates, Context Review, and Workflow Issues
The final area of the Reports landing page brings together three more perspectives on the project: estimated cost, content context, and changes made during the workflow.
Quote Estimate (1)
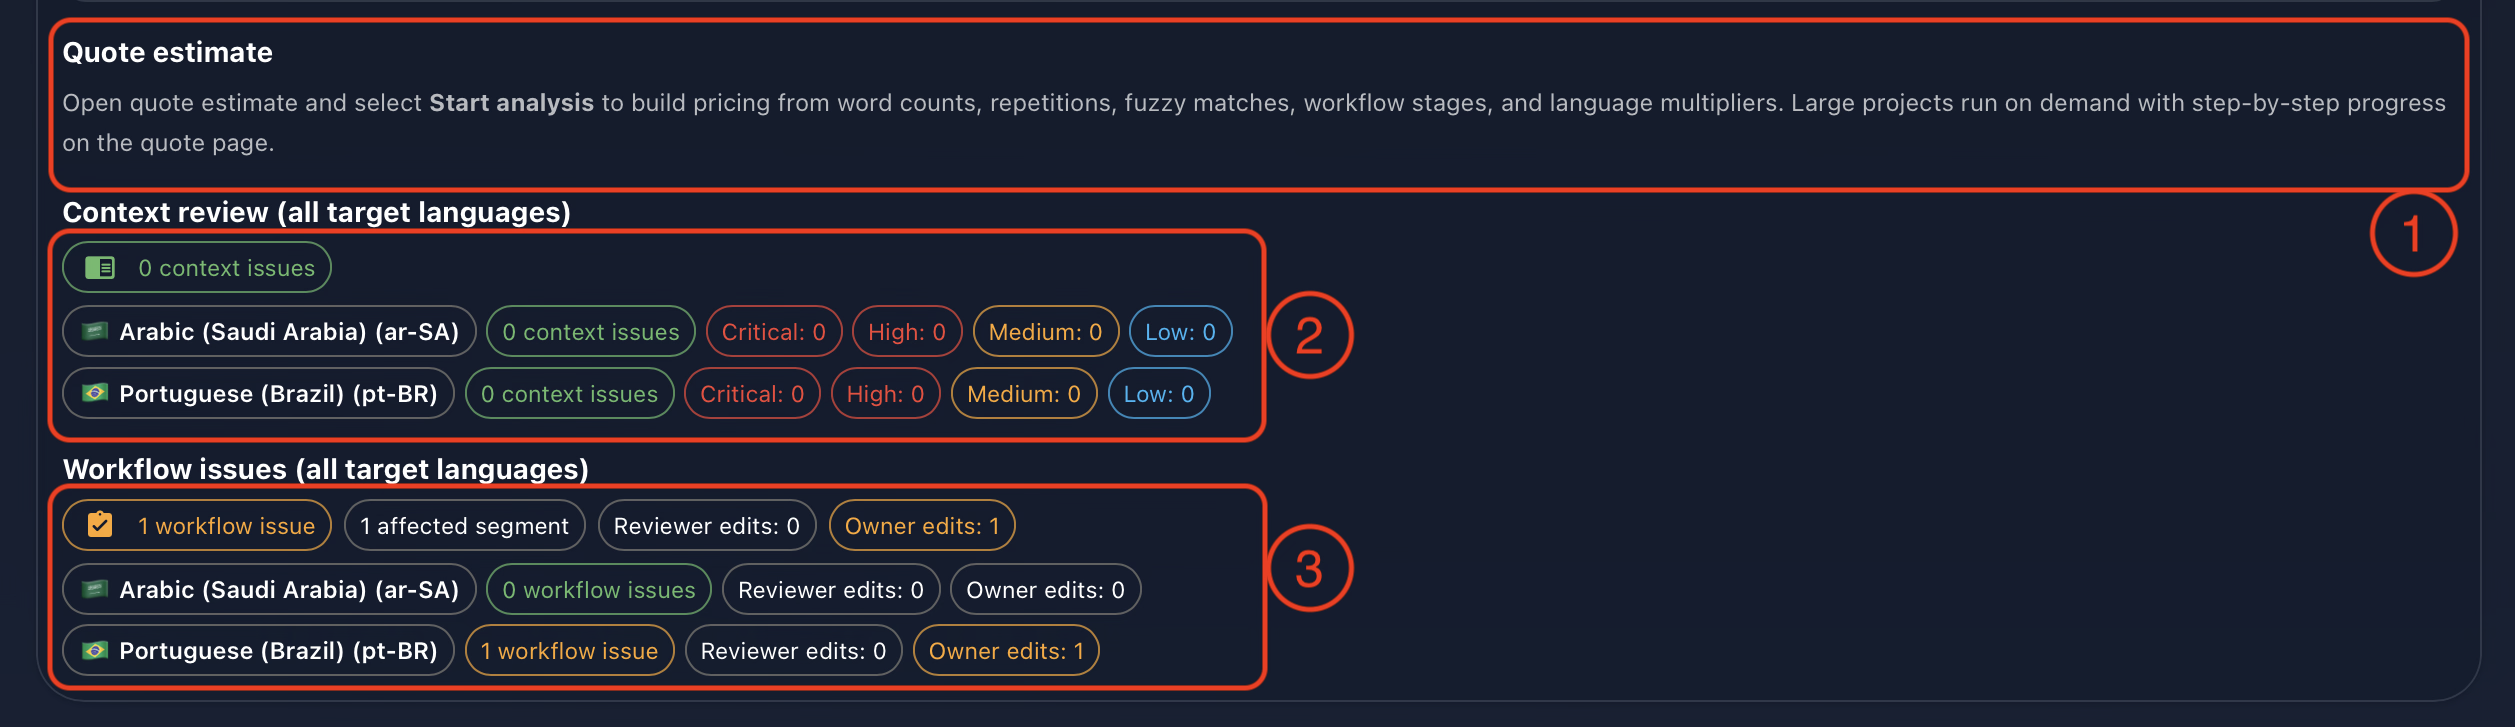
Open Quote estimate and select Start analysis to calculate pricing for the project. Gaia builds the estimate from word counts, repetitions, fuzzy matches, workflow stages, and language multipliers, using the applicable rate-card settings. Large projects run the analysis on demand, with step-by-step progress shown on the quote page.
This gives operational owners a way to understand the project’s estimated production cost within Gaia. Review the analysis scope and applicable rates when interpreting the result.
Context Review (2)
Context review uses on-device intelligence to assess content and suggest improvements where needed. Project owners decide whether to apply a suggestion or retain the original content.
The landing page summarizes detected context issues across all target languages, then breaks them down by language and severity: Critical, High, Medium, and Low. These indicators help teams locate content that needs closer attention and clarify the meaning in advance.
Workflow Issues (3)
Gaia also surfaces workflow issues based on changes made by reviewers and project owners. The overview shows the total number of workflow issues, affected segments, and reviewer and owner edit counts, with a further breakdown by language.
These signals help operational owners spot segments that may require investigation. Repeated changes can point to unclear source content, missing context, or differing expectations about the target text. Reviewing the segment and its history helps the team understand the cause and choose an appropriate response.
Conclusion
The Reports landing page gives stakeholders a shared view of project quality, productivity, estimated cost, context issues, and workflow friction. It is a starting point for understanding what needs attention and opening the relevant report for a closer look.
By keeping these signals connected to the project, Gaia helps teams spend less time assembling information and more time acting on it. Use the overview to guide questions, bring in the context behind the numbers, and focus support where it will have the greatest impact.
Follow Tomori Systems on YouTube, Instagram, TikTok, and LinkedIn for more Gaia updates.